
Download the PDF version of this report
Contents
- Executive Summary
- Methods
- Results
- Lack of Compliance and Enforcement
- Thousands of Students were Restrained and Secluded in Ohio Schools Last Year
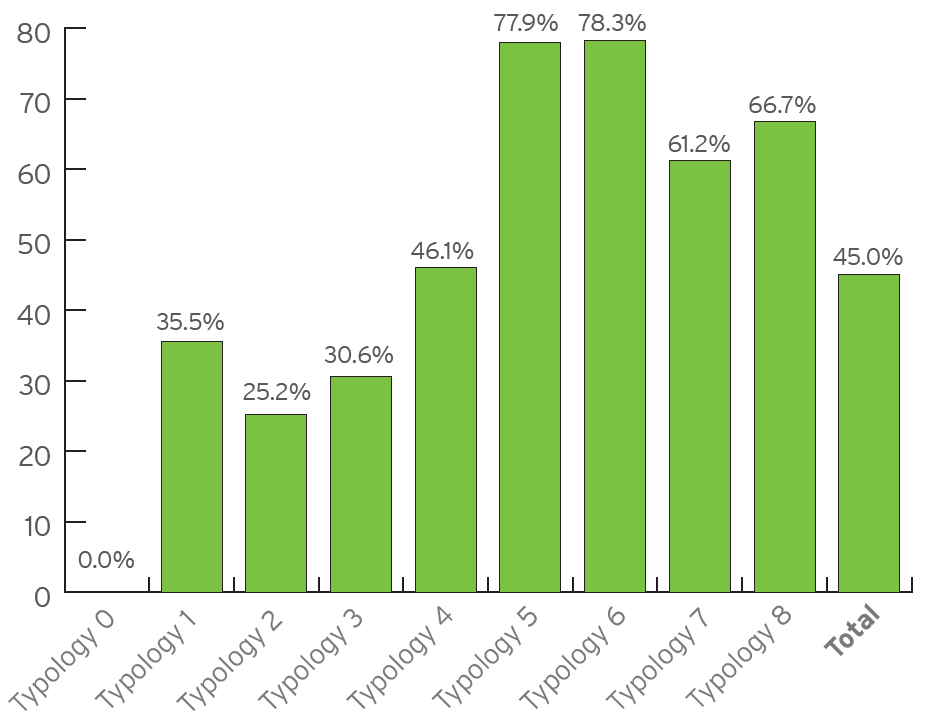
- Figure 2: Percent of School Districts Reporting Restraint by Typology
- Figure 3: Restraints per 1,000 Students by Typology for Distrcits Reporting Restraint
- Figure 4: Restraint Incidents by Disability Type, N=3,879
- Figure 5: Students Restrained by Grade Level, N=2,510
- Figure 6: Incidents of Restraint by Duration Category, N=6,926
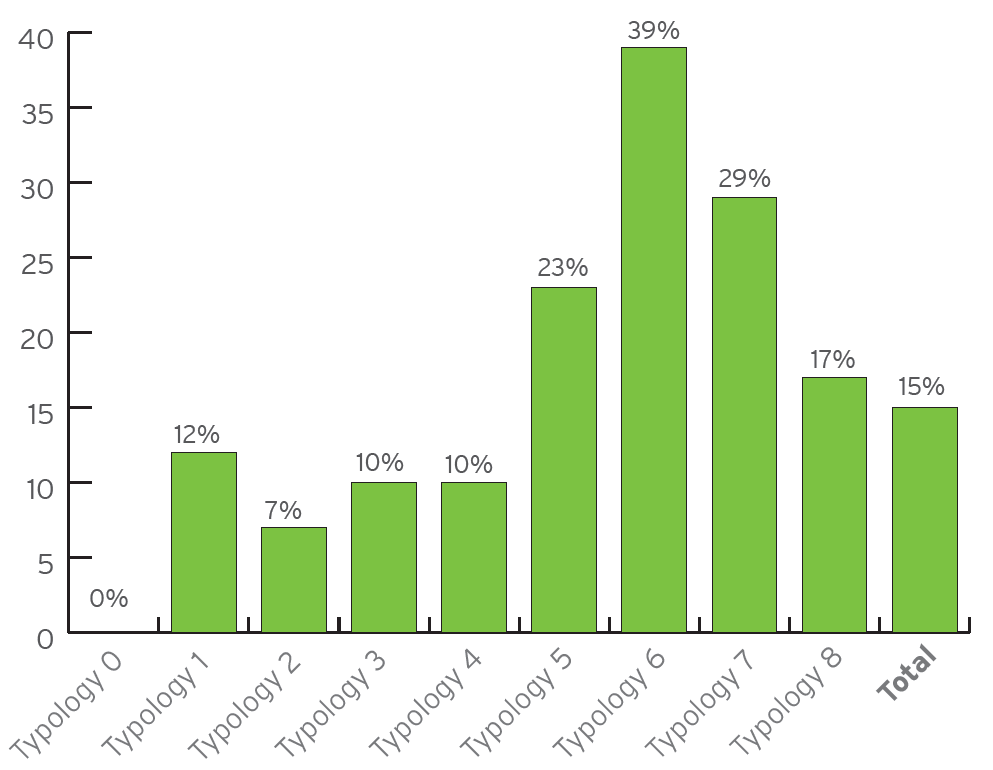
- Figure 7: Percent of School Districts That Reported Seclusion by Typology
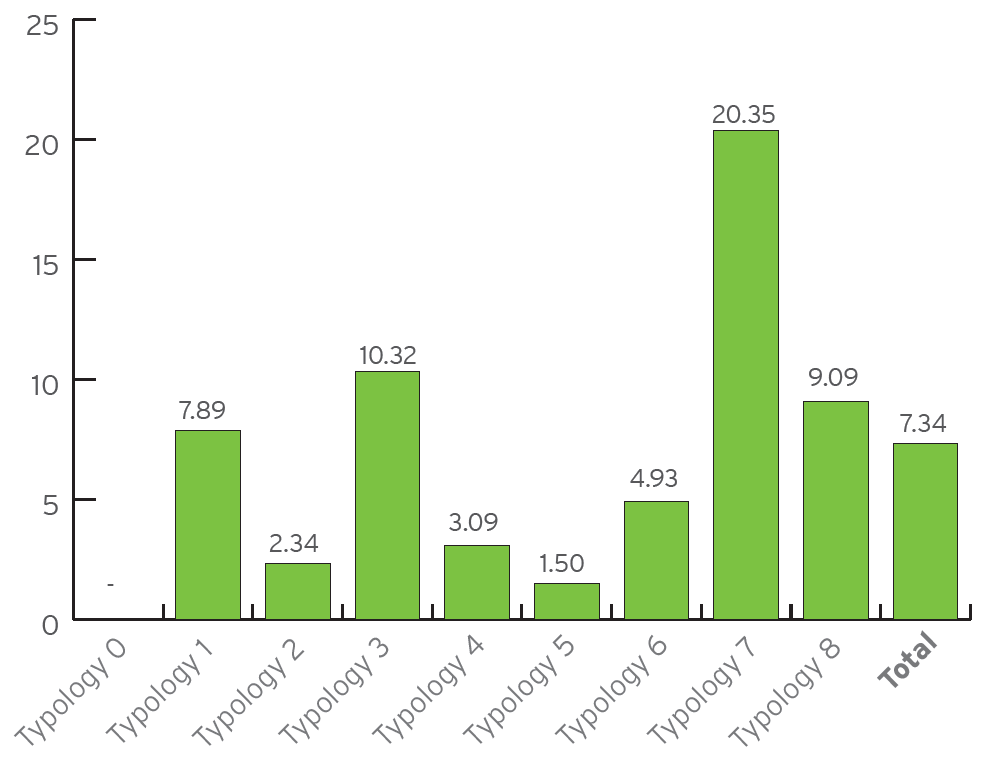
- Figure 8: Seclusions per 1,000 Students by Typology for Districts Reporting Seclusion
- Figure 9: Seclusion Incidents by Disability Type, N=1,409
- Figure 10: Students Secluded by Grade Level, N=733
- Figure 11: Incidents of Seclusion by Duration Category, N=1,905
- Overview of Incident Data
- Failure to Implement Positive Behavior Supports and Interventions
- Limitations and Recommendations
- Conclusion
- Endnotes
Executive Summary
Restraint and seclusion often conjure images of psychiatric settings, including strait jackets and isolated padded cells, or of corrections facilities with prisoners in chains and solitary confinement. Many people are surprised to learn that these methods also are used against children by educators in local school districts and in private charter or community schools. These methods are not only used to stop individuals who are currently placing themselves and others at serious risk of harm but are often used improperly as behavior management techniques for children, adolescents, and young adults.
Restraint and seclusion are highly controversial methods of controlling behavior. Not only are these methods completed against a person’s will, but they can be dangerous, leading to serious injury or death. In 2009, the National Disability Rights Network released a report detailing the nationwide use of abusive restraint and seclusion practices by teachers, school administrators, and auxiliary personnel in educational settings. The report included details on two cases that were investigated by Disability Rights Ohio, formerly Ohio Legal Rights Service1. The Government Accountability Office provided testimony on this topic to the Committee on Education and Labor for the U.S. House of Representatives. The testimony revealed that the practices of restraint and seclusion are disproportionately used on children with disabilities and have resulted in injury, trauma, and death of children2.
On August 1, 2013, after advocacy work from Disability Rights Ohio (DRO) and partner organizations, the Ohio Department of Education (Department) established rules limiting the use of restraint and seclusion and requiring the implementation of positive behavior supports for students. These rules prohibit the use of prone restraint and limit the use of seclusion and restraint to situations that pose an immediate risk of physical harm.
One of the most important aspects of the rules is Ohio Administrative Code 3301-35-15(J), which requires that school districts annually report information regarding their use of restraint and seclusion to the Ohio Department of Education. The 2013-2014 school year was the first year school districts were required to report this restraint and seclusion information to the Department. DRO has numerous concerns about the reporting process and what it revealed about the continuing prevalence of restraint and seclusion, as well as the lack of positive behavior interventions and supports.
This report provides a detailed analysis of the data that was collected by the Ohio Department of Education in compliance with Ohio Administrative Code 3301-35-15(J) for the 2013-2014 school year.
The survey design created challenges for analysis as described later in this report (see Limitations and Recommendations); however, the results of the survey did demonstrate the following:
Overall lack of compliance with reporting requirements
More than 40 school districts did not complete the survey, including two of Ohio’s largest school districts. The lack of compliance with the reporting requirement highlights general enforcement and compliance problems. Without all data accounted for, one can assume the number of seclusion and restraint incidents in Ohio’s schools has been underestimated. Without an accurate estimate, it will be difficult for the Department to make annual comparisons to determine if strategies to reduce restraint and seclusion are working.
Thousands of incidents of restraint and seclusion were reported during the school year, many involving young students with disabilities
Even accounting for the underestimates caused by underreporting, there were thousands of incidents of restraint and seclusion reported by Ohio’s school districts last year. More than 10,000 incidents of restraint and seclusion were reported, despite the rule’s ban on restraint and seclusion unless there is immediate risk of physical harm. Most of the incidents of restraint or seclusion involved students with disabilities, many of whom were students in third grade or younger.
School districts are not implementing positive behavior interventions and supports
Despite the Department’s efforts to train school districts to implement positive behavior interventions and supports, school districts reported that nearly half (47%) of incidents of restraint and more than one third (34.9%) of incidents of seclusion resulted in no further action. Providing trainings on this issue is not enough to ensure that each incident of restraint or seclusion results in the development of an appropriate positive behavior support plan or the review of an existing plan.
Methods
The Ohio Department of Education (Department) developed a survey that school districts completed to meet the reporting requirements outlined in the Ohio Administrative Code. Disability Rights Ohio (DRO) submitted several requests to the Department requesting the results of the survey. In November 2014, the Department provided DRO with a spreadsheet of survey responses. Prior to providing DRO with the survey responses, the Department redacted any data that could lead to the identification of an individual student.
In order to develop comparisons and stratify the districts, DRO used the Typology of Ohio School Districts, the Department-created classification of similar districts. The Department used several data sources to group school districts together, including urban/rural area, population, and student poverty.
TABLE 1: TYPOLOGY DESCRIPTIONS
| Typology | Description |
|---|---|
| 0 | Schools that do not have Typology Code |
| 1 | Rural – High student poverty and small student population size |
| 2 | Rural – Average student poverty and very small student population size |
| 3 | Small Town – Low student poverty and small student population size |
| 4 | Small Town – High student poverty and average student population size |
| 5 | Suburban – low student poverty and average student population size |
| 6 | Suburban – very low student poverty and large student population size |
| 7 | Urban – high student poverty and average student population size |
| 8 | Urban – very high student poverty and very large student population size |
DRO downloaded the list of each school district’s typology and enrollment data from the Department’s website in November 2014. School districts were matched to the typology data using the district ID number provided on the survey.
Public school districts and private, community and charter schools submitted survey responses on restraint and seclusion. Public school districts were required to submit reports. While private, charter and community schools were not yet required to submit reports, some elected to do so. This report analyzes responses provided by the public schools included in the Department’s typology.
In order to compare across typologies, frequencies were calculated on the number of seclusions or restraints per 1,000 students. The Department typology data located on the Department’s website (accessed November 2014) provided enrollment data for frequency calculations. When totaling restraint incidents per 1,000 students by typology the following calculation was used:
Total number of incidents of restraint/ Total number of students enrolled in school districts that reported restraint
Schools that did not report at least one incident of restraint were not included in the calculations. The same process was used to calculate the frequency for the number of students secluded per 1,000 students.
The survey did not contain a question asking the school districts if they used restraint or seclusion. Many school districts reported zero incidents of restraint or zero incidents of seclusion. This does not mean that these districts have any sort of policy that prohibits the use of restraint or seclusion, but that there were no incidents of restraint or seclusion reported during the current reporting period.
RESULTS
Lack of Compliance and Enforcement
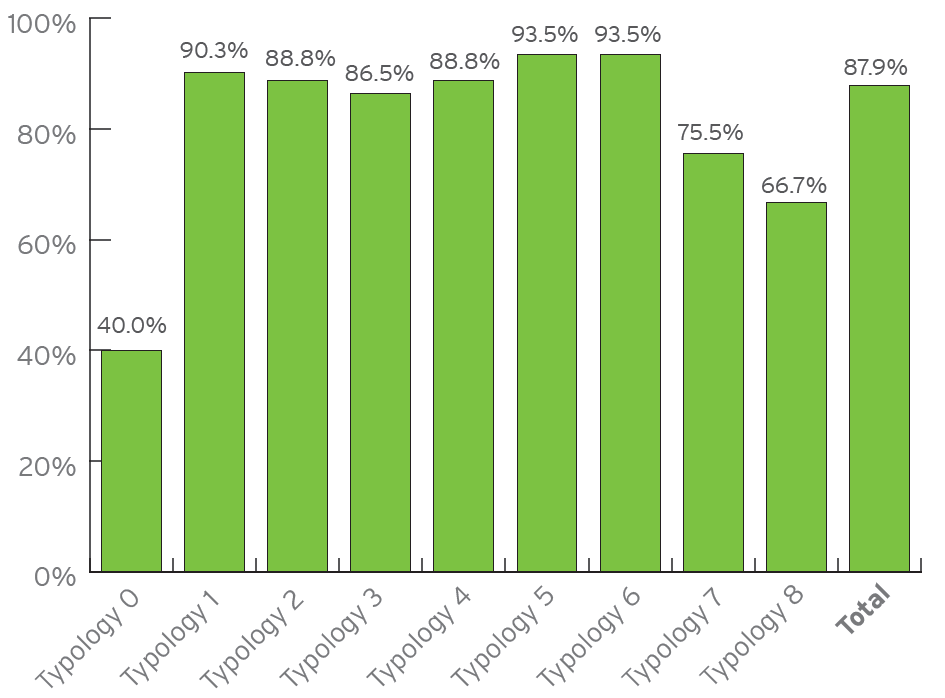
Not all school districts reported data to the Department (Figure 1). Reports were submitted by 540 of 614 school districts (87.9%). School districts coded as Typology 7 and Typology 8 had the lowest rates of survey submission. Two of the state’s largest school districts did not submit survey responses. More than 190,000 students are enrolled in the school districts that did not report data.
Survey submission does not mean survey completion. Many school districts submitted surveys but declined to provide responses to some of the questions. Out of the 540 school districts that submitted surveys, more than half (53%) did not complete all of the survey questions. The large number of school districts that did not submit surveys, combined with the large number of school districts that did not complete all of the responses, indicates that there is a lack of compliance with the rule.
In addition to the low rates of survey submission and completion, it is clear that some of the personnel completing the survey were not knowledgeable about incidents of restraint and seclusion in the school district. One school district submitted a response of “unknown” to a question, and another school district prefaced the response with the phrase “to my knowledge.” These responses indicate that the personnel in these districts who were completing the surveys were not certain or aware of all of the incidents of restraint and seclusion in their district, possibly leading to inaccurate data reporting. In addition, some school districts reported very low incidents of restraint and seclusion. For example, one large school district in Ohio reported only one incident of restraint during the entire school year, which is highly unlikely.
All of these factors lead to the conclusion that the numbers of incidents of restraint and seclusion that have been reported are underestimated, and the actual number of incidents of restraint and seclusion occurring in Ohio’s schools is likely much higher.
Due to this underreporting, it is quite possible that school districts that appear to have very high numbers actually may be adequately reporting incidents of restraint and seclusion, while other school districts that reported no incidents of restraint or seclusion are simply not reporting accurate numbers. Therefore, any examination of a particular school district’s reported data on restraint and seclusion should be interpreted with caution.
Thousands of Students were Restrained and Secluded in Ohio Schools Last Year
Even with the numbers being dramatically underestimated, there were thousands of incidents of restraint and seclusion reported during the past school year, many involving students with disabilities. This is despite the fact that the Department rules state that these dangerous interventions can only be used when there is an immediate risk of physical harm.
TOTAL INCIDENTS OF RESTRAINT
Forty-five percent of school districts reported that there had been at least one incident of restraint or at least one student had been restrained during the school year (Figure 2).
Approximately 7,633 incidents of restraint were reported during the school year. This number is approximate because several schools had data redacted. Of the school districts reporting restraint, there was an average of 7.28 reported incidents of restraint per 1,000 students enrolled (Figure 3).
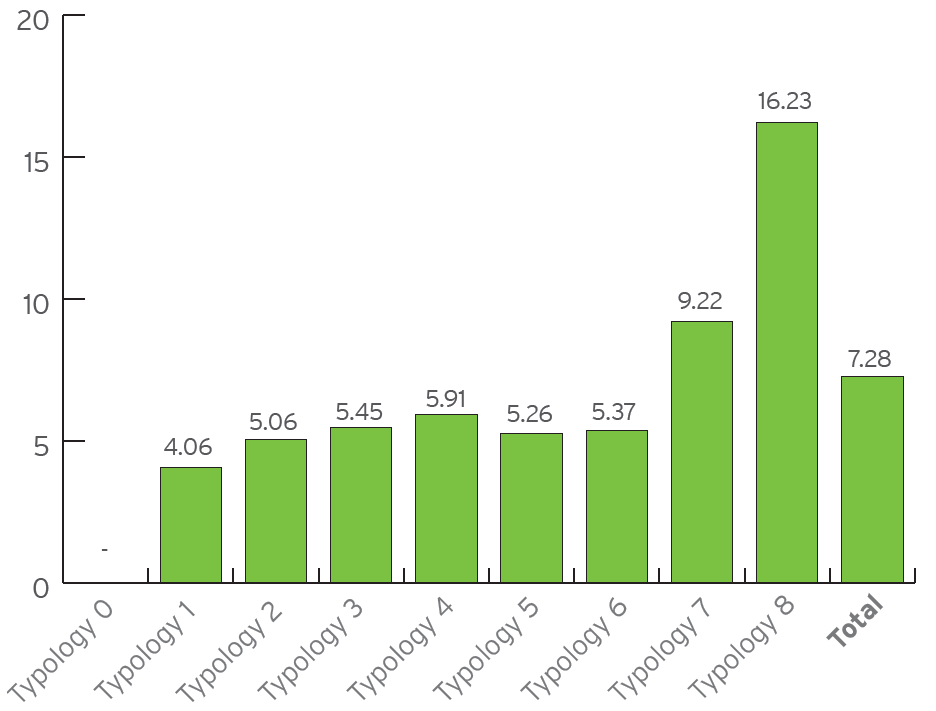
School districts reporting restraints in Typology 7 and Typology 8 had higher incidents of restraint per 1,000 students than the average.
INCIDENTS OF RESTRAINT BY DISABILITY CATEGORY
School districts reported data by incidents of restraint, not by particular student. It is possible for one student to experience restraint multiple times.
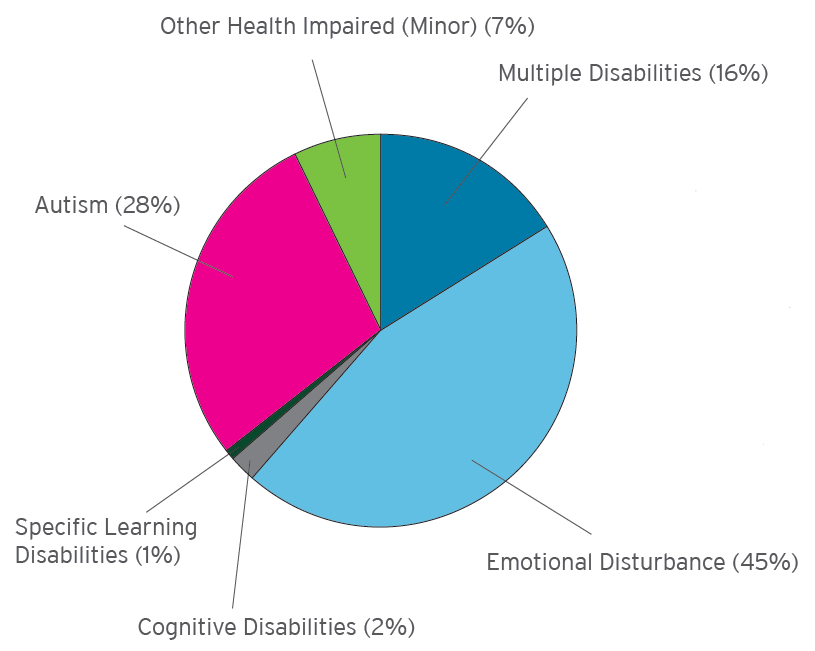
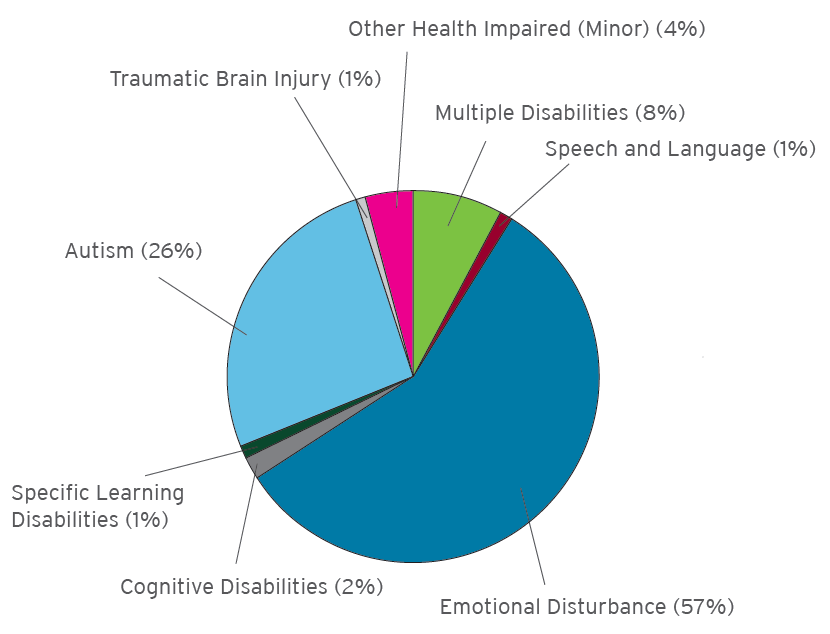
FIGURE 4: RESTRAINT INCIDENTS BY DISABILITY TYPE, N=3,879
OTHER DISABILITY CATEGORIES WITH 0% REPORTED:
Deaf-Blindness
Hearing Impairment
Visual Impairment
Speech and Language Impairment
Orthopedic Impairment
Traumatic Brain Injury
Other Health Impaired (Major)
Developmental Delay
Only 3,879 incidents of restraint were coded by disability category (Figure 4), even though districts reported 7,633 total restraints. According to the survey, 45% of incidents of restraint involved a student with emotional disturbance, 28% of incidents of restraint involved a student with autism, and 16% of restraint incidents involved a student with multiple disabilities. General education students were involved in 290 incidents.
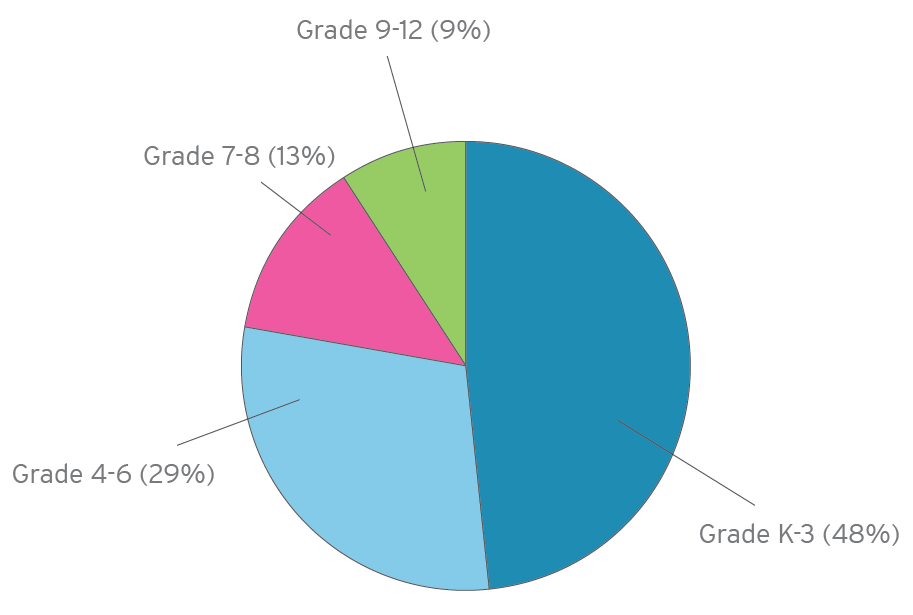
GRADE LEVEL
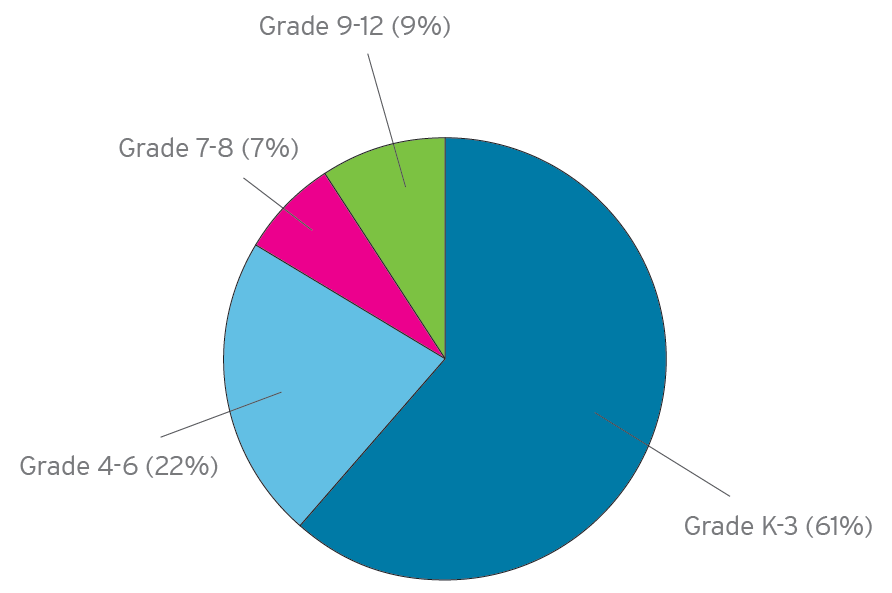
A majority of the students who had experienced restraint during the school year were in grades K-3 (Figure 5). School districts were not asked how many preschool students were restrained. The sum of the number of students in all grade level categories was 2,510. However, it is inappropriate to state that this is the total number of students who experienced restraint during the school year. Many districts did not submit answers to these questions, and other school districts had this data redacted before it was provided to DRO. The amount of missing and redacted responses indicates that 2,510 students is an underestimate of how many students were restrained during the school year.
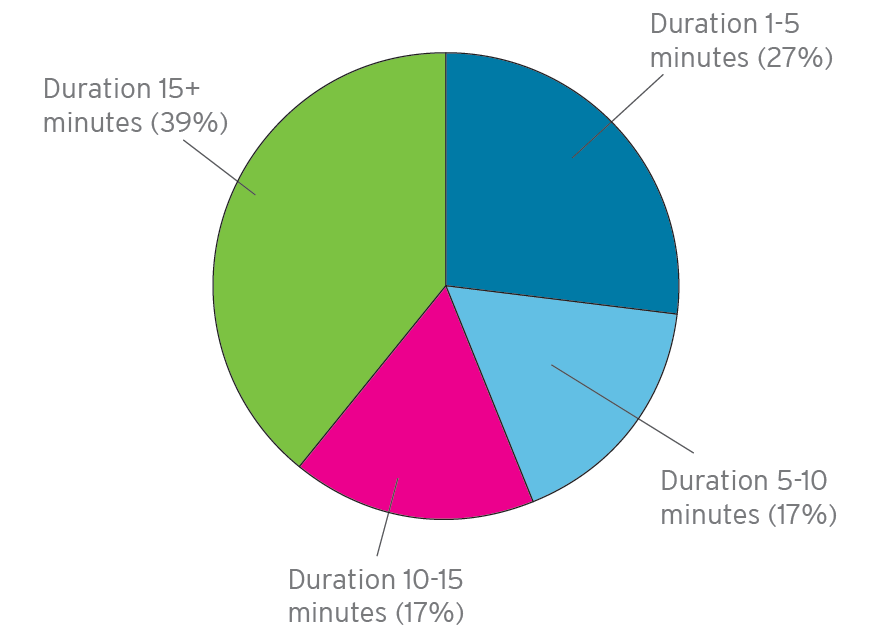
DURATION OF RESTRAINT
School districts were not required to report the number of minutes per restraint incident. Instead, school districts were asked to indicate how many incidents of restraint were in each of four categories: one minute to five minutes, five to 10 minutes, 10 to 15 minutes and more than 15 minutes. The survey did not ask how many incidents of restraint lasted less than one minute.
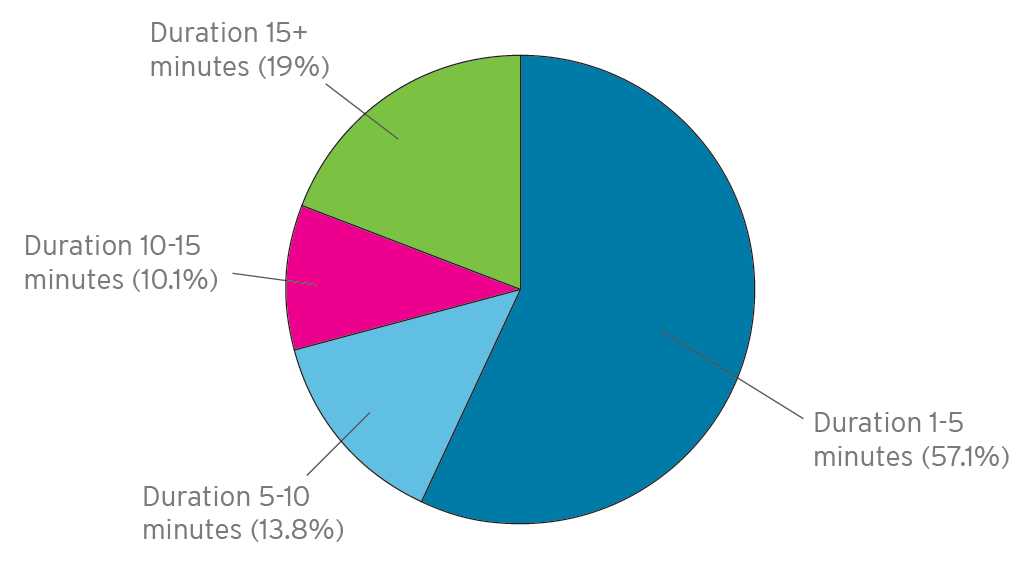
Of the school districts that reported restraint durations, 57% of the reported incidents of restraint lasted between one and five minutes, and 19% of incidents of restraints lasted longer than 15 minutes (Figure 6).
TOTAL INCIDENTS OF SECLUSION
Ninety-four school districts (15.3%) reported at least one incident of seclusion or that at least one student had been secluded during the school year (Figure 7).
Approximately 3,050 incidents of seclusion were reported to have occurred during the school year. (This number is approximate because several schools had data redacted.) School districts that reported using seclusion had an average of 7.34 incidents of seclusion per 1,000 students enrolled (Figure 8).
INCIDENCE OF SECLUSION BY DISABILITY CATEGORY
School districts were not asked to provide data on how many students in a disability category experienced seclusion. Instead, school districts were asked to report on the number of incidents of seclusion that involved a student in a certain disability category.
FIGURE 9: SECLUSION INCIDENTS BY DISABILITY TYPE, N=1,409
OTHER DISABILITY CATEGORIES WITH 0% REPORTED:
Deaf-Blindness
Hearing Impairment
Visual Impairment
Orthopedic Impairment
Other Health Impaired (Major)
Developmental Delay
Across all districts that provided responses for disability type, 60% of incidents of seclusion involved a student with emotional disturbance, 27% involved a student with autism, and 8% of seclusion incidents involved a student with multiple disabilities (Figure 9). School districts were asked how many incidents involved general education students, and school districts reported a total of 132 incidents involving general education students.
Students Secluded
School districts were not required to report the total number of students who had experienced seclusion during the school year. Instead, school districts were asked to report the number of students secluded by certain categories.
GRADE LEVEL
Nearly of half (48%) of all students who were secluded were in grades K-3, and over one-fourth (30%) of students who were secluded were in grades 4-6 (Figure 10). The survey did not ask districts how many preschool students were secluded. The sum of the number of students in all categories was 733. However, it is inappropriate to state that this is the total number of students who had experienced seclusion during the school year. Many districts did not complete this section of the survey, and other school districts had this data redacted before it was provided to DRO.
Duration of Seclusion
Of the school districts that submitted responses to questions on duration, 39% of incidents lasted longer than 15 minutes (Figure 11).
School districts were not required to report the number of minutes per seclusion incident. Instead, school districts were asked to indicate how many seclusion incidents were in each of four categories, one minute to five minutes, five to 10 minutes, 10 to 15 minutes and more than 15 minutes. School districts were not asked how many incidents of seclusion lasted less than one minute. More than one-third of incidents (39%) lasted longer than 15 minutes.
Overview of Incident Data
Even with missing data it is clear that thousands of incidents of restraint and seclusion are occurring in Ohio’s schools. Additionally, many incidents of restraint and seclusion involve young children, those in kindergarten through third grade. Because of the survey design and the lack of complete surveys from the school districts, it is not really possible to determine how many incidents involve students who have disabilities compared with students who do not have disabilities, but the large number of incidents that were coded by disability category indicates that a large percentage of these incidents involve a student with a disability.
FAILURE TO IMPLEMENT POSITIVE BEHAVIOR SUPPORTS AND INTERVENTIONS
The Department has highlighted efforts to train school district personnel in positive behavior interventions and supports (PBIS). PBIS is a systemic approach to not only implement evidence-based practices and data-driven decision making, but also implement a culture that reinforces desired behaviors, diminishes reoccurrences of challenging behaviors, and teaches appropriate behaviors to students. PBIS identifies root causes of behavior and addresses those causes. One essential component is the development of positive behavior support plans. These plans are individualized for students based on assessments of their particular needs and may include modifications to the environment, prevention strategies, instruction of replacement skills, and lifestyle outcome goals. The plans should be frequently reassessed to ensure that the student is reaching goals and that the plan is appropriate. If a student experiences an emergency situation where restraint or seclusion is needed to prevent physical harm, it is important to either establish a positive behavior support plan or to review the student’s existing plan to ensure that it still meets the student’s needs in order to prevent future incidents of restraint or seclusion. While there has been an increasing focus on providing trainings for use of these supports, the data reported by school districts indicates that there is much work to do to ensure that these methods are being implemented throughout the schools.
Actions Taken After Restraint
The survey asked for open-ended responses about what occurred after incidents of restraint. Incidents of restraint and seclusion are serious events, and each incident should result in an assessment of the student and the development of a plan to determine how to prevent future incidents. School districts were asked how many incidents of restraint resulted in the development of a positive behavior support plan or in the review of an existing positive behavior support plan. School districts were also asked how many incidents of restraint and seclusion resulted in “no further action."
Some school districts submitted narratives instead of numbers for this response. Narrative responses were coded as numbers for purposes of analysis. For example, if a school district responded “Functional Behavior Assessments have been conducted within 1 year for each incident of restraint totaling 18. Functional Behavior Assessment data is used to develop a Behavior Intervention Plan. Behavior Intervention Plans are modified to address behaviors and use of restraint for each student,” the response was converted to “18” for the purposes of analysis.
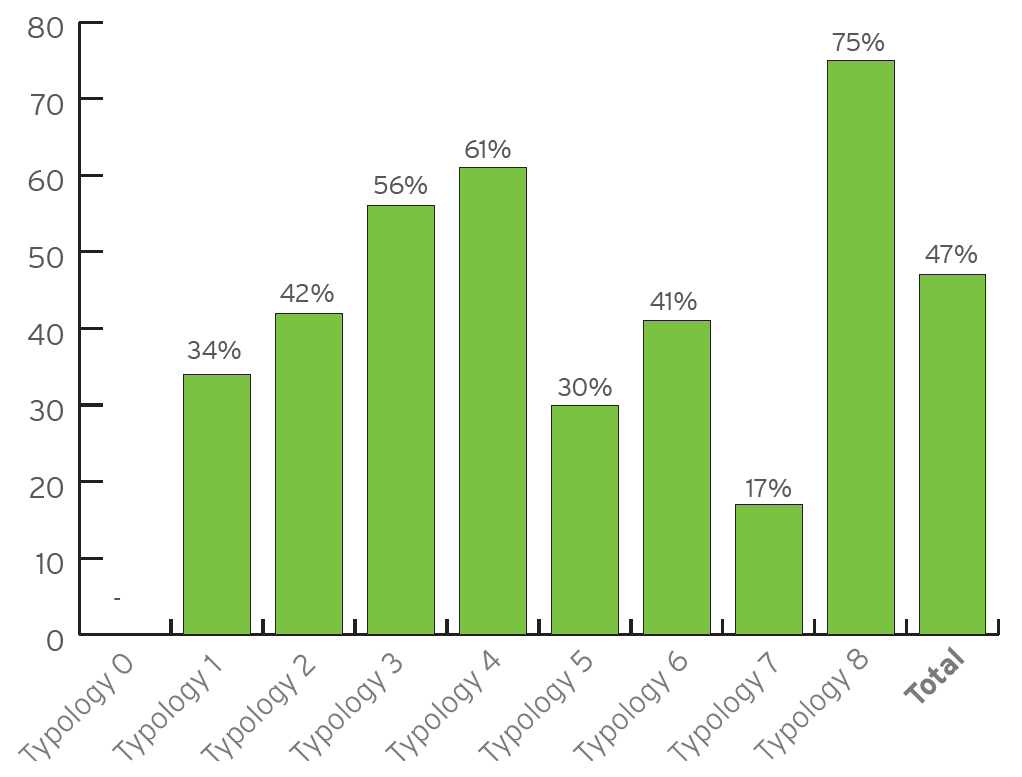
The total number of incidents of restraint that resulted in “no further action” is nearly half (47%) of the total number of incidents of restraint reported. In Typology 8, the largest school districts in Ohio, the total number of incidents of restraint that resulted in “no further action” is 75% of the total number of incidents of restraint reported for districts in that Typology (Figure 12).
It is important to note that it is possible for districts to have counted incidents in multiple categories. For example, if an incident of restraint resulted in both the suspension of a student and the review of a behavior plan, then the incident might have been counted once in each category. In many cases the total number of incidents coded by result was higher than the total number of incidents. Also, many districts did not submit responses to these questions. However, it is clear from the survey responses that school districts were reporting multiple incidents of restraint that resulted in no further action.
Actions Taken After Seclusion
The survey asked for open-ended responses about what occurred after incidents of seclusion. Similar to restraint, incidents of seclusion are serious, and each incident should be followed by an assessment of the student and their needs and the development of plan to prevent future incidents of seclusion. School districts were asked how many incidents of seclusion resulted in a positive behavior support plan or in the review of an existing positive behavior support plan. School districts were also asked to report on the number of incidents of seclusion that resulted in no further action. For the purposes of analysis, narratives were converted to numbers, as with similar data provided on restraint.
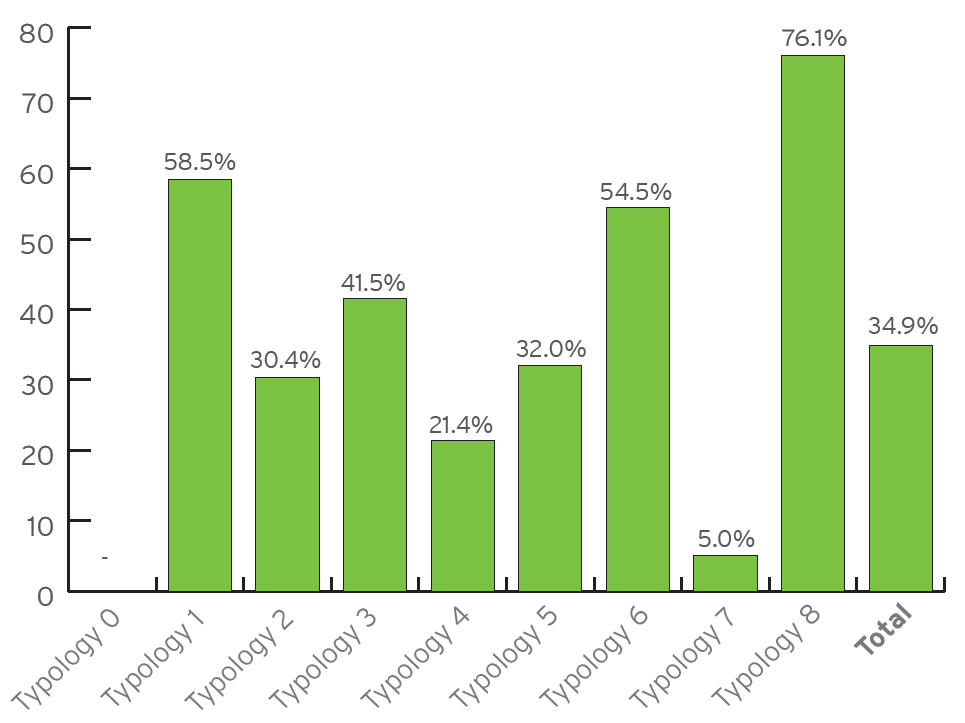
The total number of incidents of seclusion that resulted in no further action is 34.9% of the total number of incidents of seclusion reported (Figure 13). The total number of incidents of seclusion that resulted in no further action reported by Typology 8 school districts, the state’s largest districts, totaled 76.1% of the total number of seclusions.
Similar to the responses for restraint, school districts could have coded an incident in multiple categories, and in many cases the total number of incidents coded by response was higher than the total number of incidents. However, the school districts did report a large number of incidents of seclusion that resulted in no further action being taken by the district. These responses indicate that, while there might be increased encouragement from the Department and training for the development and review of positive behavior support plans, school districts are not effectively utilizing PBIS to reduce restraint and seclusion.
LIMITATIONS AND RECOMMENDATIONS
DRO analyzed the data that was made available; however, it should be noted that there are concerns about the quality of the data. Individuals who were completing the survey did not always appear to be knowledgeable about restraint and seclusion, surveys were incomplete, conflicting data was submitted, the data type collected made data analysis challenging, and the survey did not include important questions regarding restraint and seclusion practices.
Knowledge of Individuals Completing the Survey
Some survey respondents entered responses that indicated they did not have all of the information they needed. For example, one respondent, when asked to report the total number of seclusions in their school district entered, “To my knowledge, 3.” Another respondent, when asked how many incidents of seclusion involved a general education student, responded, “I am not aware of a seclusion in our district. I am not aware of a student not being able to leave a room.” When asked how many restraint incidents resulted in a support plan, a respondent provided the answer, “unknown,” which is not the same as reporting that there were “0” incidents. These responses indicate that the person completing the survey was not knowledgeable about restraint and seclusion activities in the district.
RECOMMENDATIONS
- Require that someone knowledgeable about restraint and seclusion practices complete the survey.
- Ask survey respondents to list which data sources are used when completing the survey.
Incomplete Surveys
As noted previously, more than half (53%) of respondents did not answer each question on the survey. Without every survey respondent completing all of the questions, it is difficult to analyze data, identify trends, and make appropriate comparisons.
RECOMMENDATIONS
- Require that all survey questions be completed prior to survey submission.
Conflicting Data
Some survey responses also contained conflicting information. Some survey respondents indicated that they had “0” incidents of restraint but then reported numbers when asked how many individual students had been restrained. Additionally, for some respondents, when the reported numbers of incidents of restraint or seclusion by grade level were summed, the number did not equal the total number of incidents. This indicates that the data reported is inaccurate.
RECOMMENDATIONS
- Only allow for survey submission if the total number of incidents listed per category (disability type and no disability, grade level, duration, action taken after incident) is equal to the total number of incidents reported.
Inappropriate Data Type
Surveys allowed for narrative responses when numerical responses would have been more appropriate. This presented a challenge for data analysis because narrative responses had to be coded as numerical responses.
RECOMMENDATIONS
- Only allow for numerical responses for questions in which the Department is collecting data on the number of incidents.
- Only allow for whole number responses for questions concerning the number of teachers trained.
- Allow districts to select from a drop-down list for categorical responses, such as the type of training that was provided to staff. The Department may allow them to also select “other” and enter in an appropriate response if the particular training that they used is not listed.
Additional Questions Needed
The survey did not ask questions concerning other important topics that should be monitored by the Department. It was not possible to analyze training of staff because the school districts did not report their total number of staff. This survey also did not address other important aspects of the Department’s restraint and seclusion rule, such as whether these interventions are being used only during emergency circumstances, or if parents are receiving appropriate notification. Additional questions could be added to increase knowledge in these areas.
RECOMMENDATIONS
- Collect data on the total number of staff in the district.
- Collect data on the total number of students who experienced restraint or seclusion in addition to number of incidents.
- Collect data on the number of students in each disability category who experienced restraint or seclusion, in addition to the number of incidents that involved students in each disability category.
- Collect data on the number of students who experienced injuries, in addition to collecting data on the number of incidents that resulted in injuries.
- Collect data on reasons why restraint or seclusion was chosen as an intervention method.
- Collect data on notification of parents or guardians after incidents of restraint or seclusion.
Conclusion
The analysis of the Ohio Department of Education’s survey responses reveals a large amount of underreporting of incidents of restraint and seclusion in Ohio’s public schools. Even with the large amount of underreporting, there are thousands of reported incidents of restraint and seclusion occurring in public schools, most involving younger students and students with disabilities. In an overwhelming number of incidents, no further action is taken by the school to address the underlying problems and prevent these incidents from happening again in the future. While the Department is focusing on training school districts on positive behavior interventions and supports, more needs to be done to implement these practices at the school level, especially the practice of developing and reviewing positive behavior support plans. In addition, more needs to be done to accurately measure incidents of restraint and seclusion so school districts and the Department can accurately determine if training, interventions and supports are effective in reducing incidents of restraint and seclusion and keeping students safe at school. If the Department incorporates these recommendations into its reporting process for the 2014-2015 school year, it will be able to more accurately determine the prevalence of restraint and seclusion in Ohio’s schools and identify solutions to reduce the use of these dangerous techniques.
Endnotes
1 National Disability Rights Network. “School is Not Supposed to Hurt.” 2009. http://www.ndrn.org/images/Documents/Resources/Publications/Reports/School-is-Not-Supposed-to-Hurt-NDRN.pdf
2 U.S. Government Accountability Office. “Seclusions and Restraints: Selected Cases of Death and Abuse at Public and Private Schools and Treatment Centers.” Publication Number GAO-09-719T, 2009.